The Upstash Console exposes metrics in two places: the database list, and the detail page of a single database. This page explains what each chart shows.

Database List

The list view aggregates summary information across all of your databases.
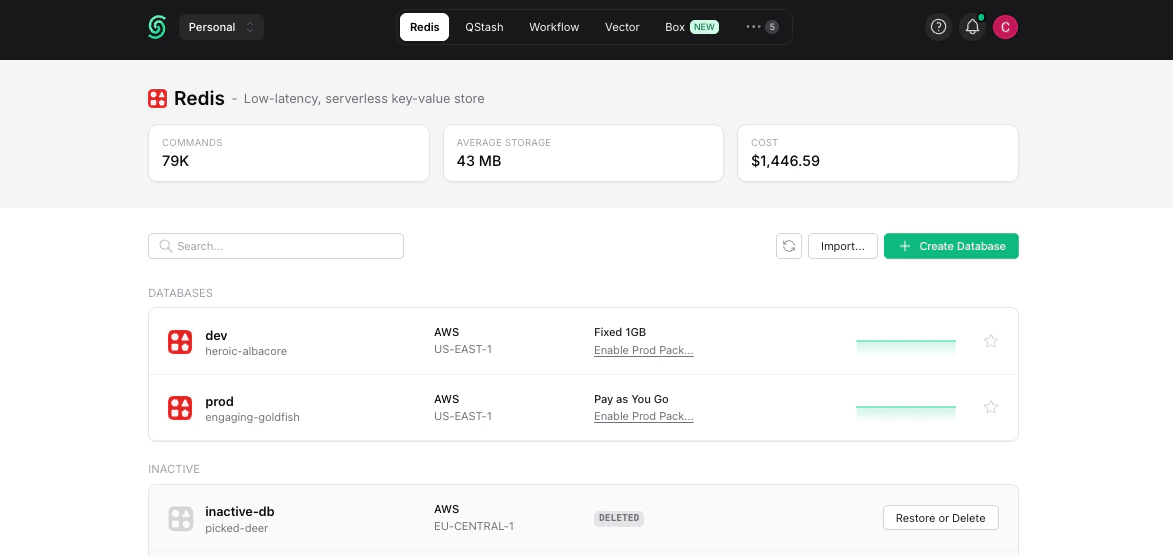
Select a Redis database to view its metrics
Click a database name to open its detail page. For each row the list shows:
  • The region of the database
  • The plan of the database (free, pay-as-you-go, fixed, or enterprise)

Database Details

By clicking on a database on the list page, you can navigate to its detail page. The charts on this page show metrics that are specific to the selected database.

Current Month

Redis metrics charts in the Upstash Console
Daily cost of the database for the current billing month.

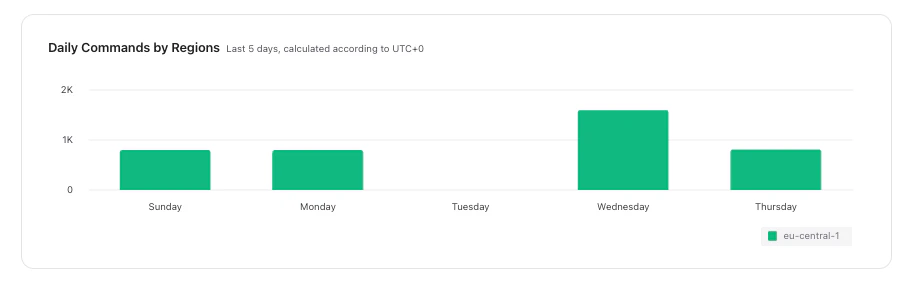
Daily Request

Redis requests over five days
Total number of requests per day, over the last 5 days.

Database Usage

If you click on the “Usage” tab, you can see more detailed charts about the usage of your database.

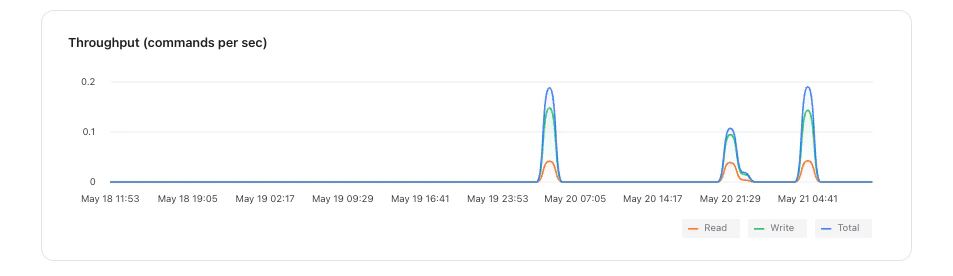
Throughput

Redis throughput chart
Throughput chart shows throughput values for reads, writes and commands (all commands including reads and writes) per second. The chart covers the last 1 hour and it is updated every 10 seconds.

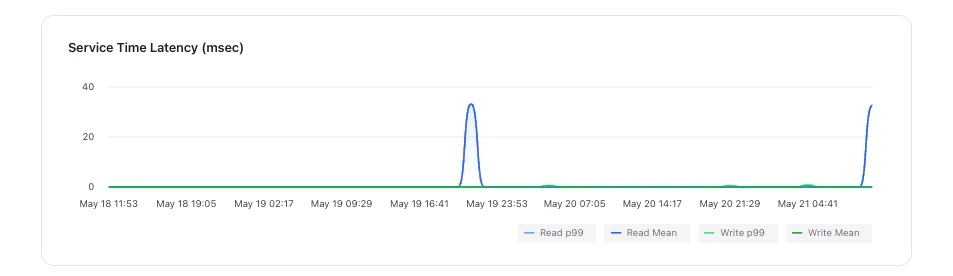
Service Time Latency

Redis latency chart
This chart shows the processing time of the request between it is received by the server and the response is sent to the caller. It shows the times in max, mean, min, 99.9 percentile and 99.99 percentile. The chart covers the last 1 hour and it is updated every 10 seconds.

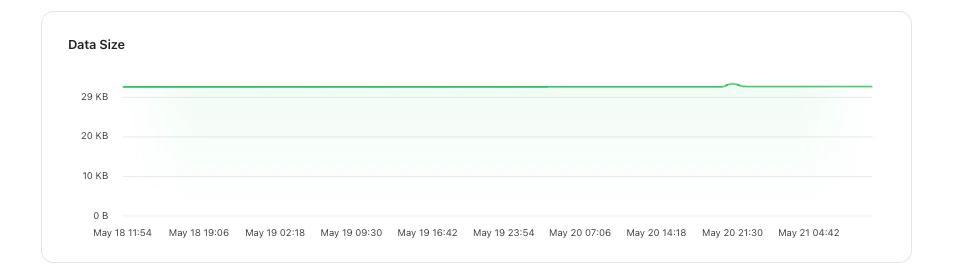
Data Size

Redis data size chart
This chart shows the data size of your database. The chart covers the last 24 hours and it is updated every 10 seconds.

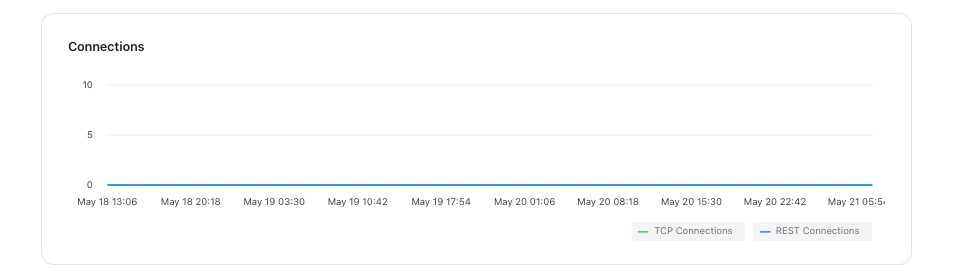
Connections

Redis connection count chart
This chart shows the number of active client connections. It shows the number of open connections plus the number of short-lived connections that started and terminated in 10 seconds period. The chart covers the last 1 hour and it is updated every 10 seconds.

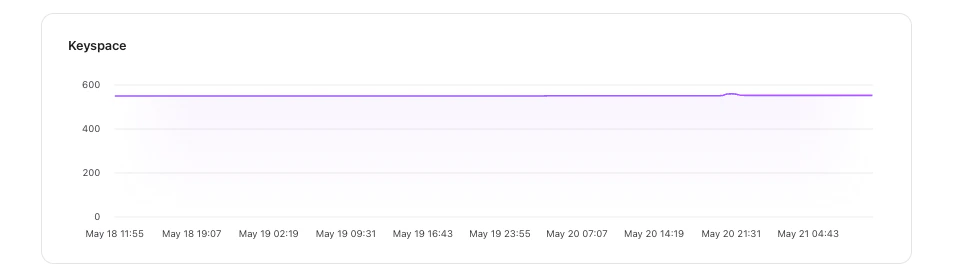
Key Space

Redis keyspace chart
This chart shows the number of keys. The chart covers the last 24 hours and it is updated every 10 seconds.

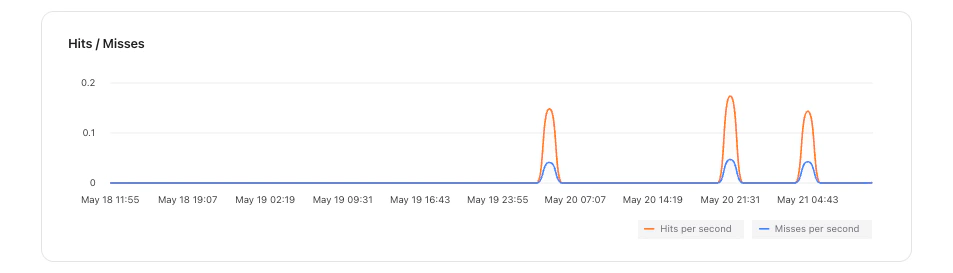
Hits / Misses

Redis cache hits and misses chart
This chart shows the number of hits per second and misses per second. The chart covers the last 1 hour and it is updated every 10 seconds.